SP Quant > Actual Performance
SP Quant - Index Trading Program is an S&P 500 Index trading program which currently consists of two strategies which trade in the same account. The strategy is designed for minimum correlation with the overall stock market. The first strategy trades SPY stocks, basically counter trend, once a day with intraday stops. There is a modification of the strategy (not currently implemented) which will also trade intraday with the trend. The second strategy is based on short options on SPY stock. If the price moves in unfavorable direction, trading with the trend is applied to offset the losses from rising premium, before the options are rolled to another strike price. The strategy uses intraday stops as well as end-of-day adjustments. The reported returns are achieved by using the standard margin percentage available with most brokerages.
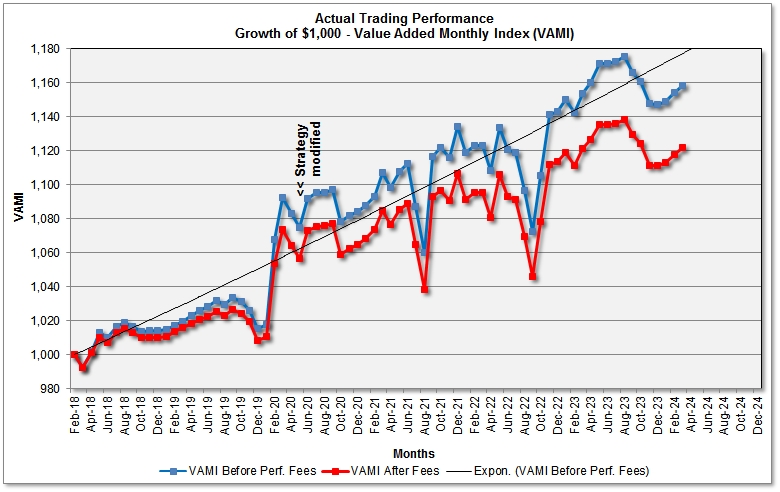
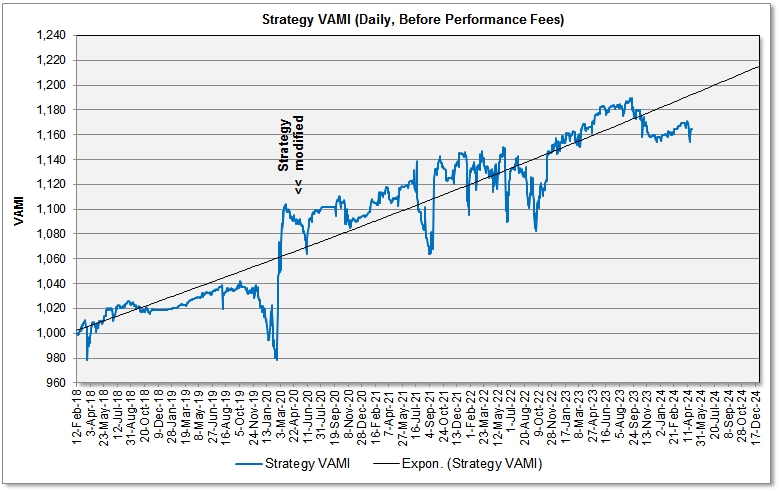
Beginning from March 2018 on this page we will be tracking the actual performance of the SP Quant - Index Trading Program. To see extrapolation into the past of the currently traded strategy, see the hypothetical performance report from strategy back testing (V2 v.02/2018) on the Backtesting page (from 1993 to 2018).
I. PERFORMANCE SUMMARY
PAST PERFORMANCE IS NOT NECESSARILY INDICATIVE OF FUTURE RESULTS. THE RISK OF LOSS IN TRADING EQUITIES CAN BE SUBSTANTIAL. YOU SHOULD THEREFORE CAREFULLY CONSIDER WHETHER SUCH TRADING IS SUITABLE FOR YOU IN LIGHT OF YOUR FINANCIAL CONDITION AND INVESTMENT OBJECTIVES.
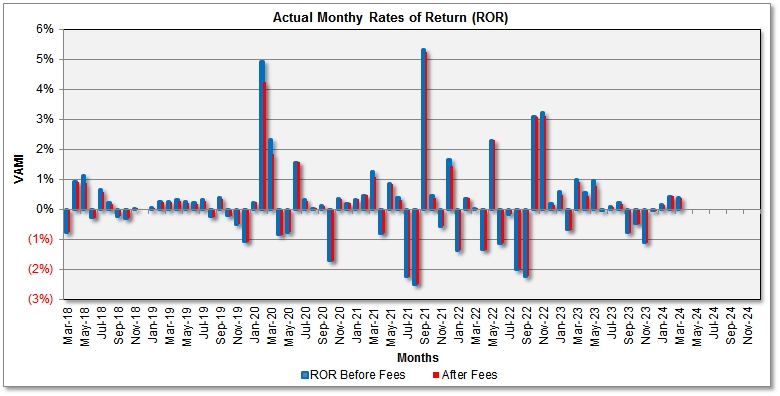
1. Monthly Rates of Return (ROR), Before/After Performance Fees
|
|
Jan |
Feb |
Mar |
Apr |
May |
Jun |
Jul |
Aug |
Sep |
Oct |
Nov |
Dec |
YTD |
VAMI |
|
2018 |
See back testing results | (0.76%) (0.76%)* | 0.94% 0.91%* | 1.12% 0.90%* | (0.28%) (0.28%)* | 0.65% 0.58%* | 0.25% 0.20%* | (0.22%) (0.22%)* | (0.29%) (0.29%)* | 0.02% 0.02%* | 0.00% 0.00%* | 1.41% 1.02%* | 1,014.1 1,010.2* | |
|
2019 |
0.05% 0.05%* | 0.26% 0.26%* | 0.26% 0.24%* | 0.34% 0.28%* | 0.26% 0.21%* | 0.23% 0.23%* | 0.34% 0.27%* | (0.24%) (0.24%)* | 0.39% 0.36%* | (0.21%) (0.21%)* | (0.49%) (0.49%)* | (1.07%) (1.07%)* | 0.11% (0.17%)* | 1,015.2 1,008.5* |
|
2020 |
0.24% 0.24%* | 4.91% 4.25%* | 2.33% 1.86%* | (0.84%) (0.84%)* | (0.76%) (0.76%)* | 1.57% 1.57%* | 0.32% 0.26%* | 0.03% 0.03%* | 0.13% 0.11%* | (1.71%) (1.71%)* | 0.36% 0.36%* | 0.21% 0.21%* | 6.83% 5.59%* | 1,084.5 1,064.9* |
|
2021 |
0.33% 0.33%* | 0.48% 0.48%* | 1.26% 1.08%* | (0.79%) (0.79%)* | 0.87% 0.86%* | 0.41% 0.33%* | (2.24%) (2.24%)* | (2.49%) (2.49%)* | 5.33% 5.25%* | 0.46% 0.37%* | (0.56%) (0.56%)* | 1.66% 1.44% | 4.59% 3.90%* | 1,134.3 1,106.4* |
|
2022 |
(1.35%) (1.35%)* | 0.38% 0.38%* | 0.01% 0.01%* | (1.35%) (1.35%)* | 2.31% 2.31%* | (1.13%) (1.13%)* | (0.17%) (0.17%)* | (1.99%) (1.99%)* | (2.22%) (2.22%)* | 3.09% 3.09%* | 3.24% 3.12%* | 0.18% 0.15%* | 0.80% 0.65%* | 1,143.4 1,113.5* |
|
2023 |
0.60% 0.48%* | (0.67%) (0.67%)* | 0.98% 0.92%* | 0.55% 0.44%* | 0.98% 0.78%* | 0.00% 0.00%* | 0.11% 0.09%* | 0.22% 0.17%* | (0.77%) (0.77%)* | (0.48%) (0.48%)* | (1.11%) (1.11%)* | (0.04%) (0.04%)* | 0.33% (0.22%)* | 1,147.2 1,111.1* |
|
2024 |
0.16% 0.16%* | 0.44% 0.44%* | 0.38% 0.38%* | (0.17%) (0.17%)* | 0.01% 0.01%* | (0.25%) (0.25%)* | 0.42% 0.42%* | (0.56%) (0.56%)* | (0.05%) (0.05%)* | (0.09%) (0.09%)* | 0.85% 0.85%* | 1.15% 1.15%* | 1,160.3* 1,123.9* | |
* - Net of 20% monthly performance fee. Returns are based on pro-forma adjustments to a proprietary account to reflect fees.
- Former version of the strategy
The above table shows actual trading results, before and after performance fees. Rates of return (ROR), net of 20% performance fee, are marked by asterisk (*). ROR figures have been calculated according to SEC regulations, by dividing the monthly net performance (gain or loss) by the nominal (notional) account size. To see the calculations, open this Excel table. See also this performance fee calculation example in Excel.
The charts below show monthly rates of return (ROR) and the growth of $1,000 (the Value Added Monthly Index - VAMI), before and after 20% performance/incentive fee deduction. Compounding by monthly profit reinvesting is used.
II. Performance Analytics (Net of 20% Performance Fee)
|
|
||||||||||||||||||||||||||||||||||||||||||||||||||||
Risk Disclaimer
THE RISK OF LOSS IN TRADING CAN BE SUBSTANTIAL. YOU SHOULD THEREFORE CAREFULLY CONSIDER WHETHER SUCH TRADING IS SUITABLE FOR YOU IN LIGHT OF YOUR FINANCIAL CONDITION AND INVESTMENT OBJECTIVES. PAST PERFORMANCE IS NOT NECESSARILY INDICATIVE OF FUTURE RESULTS. THE PERFORMANCE QUOTED REPRESENTS PAST PERFORMANCE AND CURRENT PERFORMANCE MAY BE LOWER OR HIGHER. EQUITY TRADING IS SPECULATIVE AND MAY INVOLVE THE LOSS OF PRINCIPAL; THEREFORE, FUNDS PLACED UNDER MANAGEMENT SHOULD BE RISK CAPITAL FUNDS THAT IF LOST WILL NOT SIGNIFICANTLY AFFECT ONE'S PERSONAL WELL BEING. THIS IS NOT A SOLICITATION TO INVEST AND YOU SHOULD CAREFULLY CONSIDER YOUR FINANCIAL SITUATION PRIOR TO MAKING ANY INVESTMENT OR ENTERING INTO ANY TRANSACTION.
![]() BACK TO THE MAIN PERFORMANCE PAGE
BACK TO THE MAIN PERFORMANCE PAGE